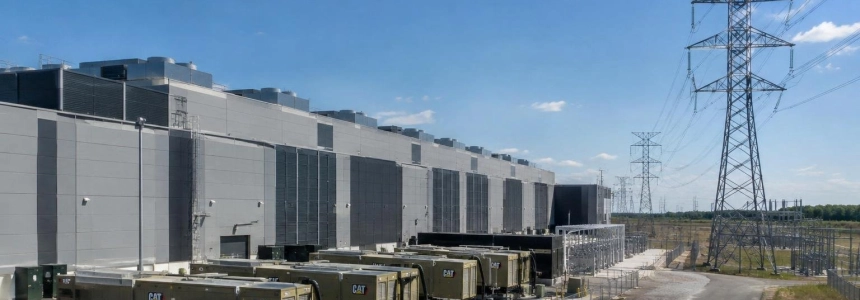
The 403 largest data centers in the United States consumed about 82 terawatt-hours in one year, and more than half of that electricity came from fossil fuels. The study, published in Nature Sustainability, attributes 25.7 million metric tons of CO₂ to those facilities between May 2024 and April 2025—a figure comparable, according to one of its authors, to Denmark’s annual emissions.
The estimate assigns figures to individual facilities for demand that is usually presented as an aggregate total. The Harvard team identified the data centers using satellite images and cross-referenced their estimated consumption with emissions data from regional electricity grids. The calculated range is 68 to 99 TWh, depending on the assumed utilization level; the central scenario is equivalent to 1.8% of all electricity consumed in the country.
What the estimate measures—and what it doesn’t
The analysis estimates the electricity consumed by each data center and attributes emissions to it based on the power generated by plants in its region. It is not a direct measurement at each power outlet, nor does it distinguish what share of the load is used for model training, AI inference, cloud services, or other operations. The researchers note that there was not enough data to study all large-scale data centers in the country.
The calculation uses a location-based method and the total generation reported by regional electricity authorities. In the central scenario, the consumption-weighted carbon intensity of these data centers was 314 grams of CO₂ per kilowatt-hour, compared with a national average of 348 grams.
| Study finding | Estimate |
|---|---|
| Total electricity, across scenarios | 68–99 TWh |
| Consumption in the central scenario | 82 TWh |
| Electricity attributed to fossil sources | 54% |
| Natural gas | 38% |
| Coal | 15% |
| CO₂ emissions in the central scenario | 25.7 million metric tons |
The gas and coal percentages add up to 53%, not 54%, because the published figures are rounded. The study estimates that emissions from the data centers analyzed range from 21 to 31 million metric tons of CO₂, depending on the load scenarios. Its central estimate is two to three times higher than a comparable figure for 2018.
“The data center boom hasn’t slowed down since our study period ended in April 2025. New facilities have been built, existing campuses have expanded, and demand for AI computing continues to grow. That means the electricity use and carbon footprint we’re reporting could already be substantially larger now in 2026.”
— Gianluca Guidi, lead author of the study and member of the Department of Biostatistics
Location changes the footprint
The national result masks substantial regional differences. More than half of the electricity studied was consumed in Virginia, Oregon, Ohio, and Iowa, and some data centers are connected to grids that depend more heavily on coal. Harvard estimates that around a quarter of the data centers’ electricity came from regions with above-average carbon intensity.
Two facilities with similar consumption can be associated with different generation mixes depending on the region where they operate.
The researchers also warn of a health dimension, though they do not quantify it in this study. Fossil-fuel generation associated with the demand can emit fine particulate matter, nitrogen oxides, and sulfur dioxide—pollutants linked to heart and lung disease and premature deaths. Exposure can affect communities near power plants, even when those plants are far from the data center.
More demand, slow grid connections
The observation period ended in April 2025, so the figures do not describe the current consumption of the entire infrastructure. Harvard notes that facility expansion and demand for AI computing have continued since then. The International Energy Agency (IEA) report, cited by The Decoder, projects that annual global data center emissions will rise from around 150 million metric tons of CO₂ to 350 million by 2035.
The same IEA analysis points to an operational reason behind some of the new fossil-fuel generation: some U.S. operators are investing in gas plants on their own sites to avoid waiting for grid connections. The agency also describes grids under pressure; in areas such as Texas and Virginia, connection requests already exceed current peak load. This does not mean every project will install its own generation, but it shows the energy cost of securing access to electricity by the quickest route.
The regulatory alternatives cited by The Decoder vary by jurisdiction: minimum payment commitments, guarantees, exit fees, flexible connections, or requirements for firm generation on-site. The International Energy Agency also notes that actively limiting computing workloads is expensive for operators: renting AI capacity costs between $20 billion and $30 billion per gigawatt per year, around a hundred times more than comparable battery storage capacity.
Efficiency alone cannot solve the supply problem
Growing consumption puts the relationship between greater computing efficiency and lower total emissions to the test. The Harvard measurement cannot determine how much electricity used by AI has grown within each data center, precisely because it does not separate specialized workloads from general ones. It does show that the total electricity consumption of this group of facilities was already considerable before the end of the period analyzed.
Meanwhile, the COP31 presidency and the International Telecommunication Union presented the Antalya Artificial Intelligence Pledge, a voluntary commitment to promote low-emissions electricity, energy and water efficiency, and environmental disclosure using standardized methods. It is not legally binding; its measures would be reviewed for the first time at COP32. The agreement proposes transparency but does not establish enforceable obligations for companies.
The difference between a commitment and an obligation also affects how companies measure their progress. The Harvard study provides aggregated results by state and region, while data for individual facilities is restricted and is not published with addresses or coordinates. The authors have made aggregated exports and code available to reproduce the main estimates, but this openness does not make it possible to publicly reconstruct the complete map of facilities.
This leaves a gap between the scale of expansion and the granularity of the available information. The study provides a verifiable benchmark for 403 data centers over a specific period; subsequent demand, the exact split between AI workloads and other services, and the trajectory of each facility remain outside this snapshot.
Sources: The Decoder, Nature, Harvard T.H. Chan School of Public Health