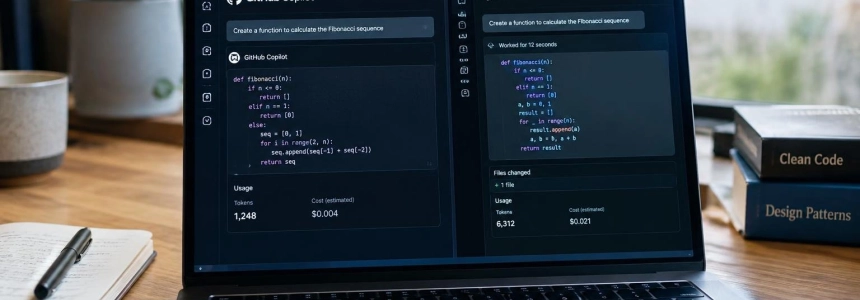
With the same model and tasks, Aider in architect mode needed around 3,500 tokens per task solved; OpenClaw, 292,000. Another benchmark found that the cost per task could vary by up to 13.1 times between harnesses. The model is not the only variable that determines how much a coding agent costs.
A harness is the layer that directs the agent’s cycle: it sends requests to the model, manages the history, calls tools, and decides when to stop. The New Stack compared several of these systems with fixed models and tasks; Composio also isolated the effect of the harness in a later study. Their figures are not a universal ranking: they correspond to different test sets and show results that change depending on the model.
Costs start before the agent gets to work
In one of the tests covered by The New Stack, each harness received the same tasks through OpenRouter and with the same model. The most striking difference appeared before the agent tackled the work: the system added instructions, tool descriptions, and environment data. The benchmark called this initial expense the “startup tax.”
This block contained about 700 tokens in Aider, in architect mode, compared with about 26,000 in OpenClaw. Since the context is sent again on every turn, this is not necessarily a cost paid only once. In the article’s calculation, repeating 26,000 tokens over fifteen turns amounts to nearly 390,000 input tokens just for that configuration text.
In that test, the startup cost multiplied by the number of turns predicted tokens per task solved with an R² of 0.99 across the two models tested. By contrast, the growth of that block over each turn did not explain the difference: each harness added a few hundred tokens per turn. The initial volume and the number of times it is processed are therefore variables a team can observe and change without replacing the model.
The comparison of 3,500 versus 292,000 tokens measures consumption per task solved. In another evaluation, Composio found differences of up to 13.1 times in cost per task, depending on the model and test set.
Cost, success, and time do not always move together
Composio kept the model, task set, and tool catalog fixed while comparing harnesses. With DeepSeek V4 Pro, nine options completed between 30% and 60% of a 30-task battery; the cost per task ranged from $0.101 to $0.252. In a second evaluation with GPT-6 Astra, six harnesses achieved between 66% and 72% success, with costs of $1.20 to $15.72 per task.
| Model and test | Harnesses | Observed success | Cost per task |
|---|---|---|---|
| DeepSeek V4 Pro, 30 tasks | 9 | 30%-60% | $0.101-$0.252 |
| GPT-6 Astra, 29 shared cases | 6 | 66%-72% | $1.20-$15.72 |
In the second test, five of the six systems fell within a range of $1.20 to $1.63. Claude Code was the outlier, at $15.72 per task, with the highest token usage—1.547 million—and the longest average time, 194 seconds. However, it ranked fourth in success, at 69%. This shows why comparing only price or only the success rate can obscure the system’s actual behavior.
The results also do not allow a winner with one model to be carried over unchanged to another. Among the six harnesses present in both tests, the order changed; Pi Agent, for example, tied for second place with DeepSeek and ranked fifth with GPT-6 Astra. Composio cautions that a sample of six comparisons is not enough to establish whether rankings across models are related.
Turns and caching change the bill
The number of turns matters because each request processes the accumulated history again, including tool results and schemas. Composio tested three ways of providing planning instructions with Sonnet 4.5 and the same harness. When planning was loaded as an invocable skill, the system used 33.4% fewer tokens than the configuration without planning, with the same 100% success rate on that eleven-case battery.
The test also recorded 21.5% fewer turns and 21.8% less time. But the battery already reached 100% success without planning, so it cannot establish whether that strategy helps with harder tasks. Planning inserted directly into the prompt missed one case; the favorable result applies to the variant that offered it as a skill.
Caching can change the cost even when gross token consumption seems unfavorable. In Composio’s test, Claude Code got 1.5% of its input tokens from the cache; Codex, approximately 70%; and OMP, 57%. New input cost about five times more than input served from cache, so Codex was cheaper per task than a harness that used half as many tokens without caching.
There is an important caveat when attributing this difference. The New Stack linked Claude Code’s low cache rate to the route its requests took through OpenRouter and the translation of a message format, not to the text of its instructions. In that run, it was the only harness using the Anthropic-style messages endpoint through the gateway. This is a finding about that integration route, not a demonstrated property of the product in every configuration.
Available tools also change the outcome
The harness does not operate in isolation: connections to applications determine which actions the agent can attempt. Across eleven connector comparisons, Composio recorded a 99% completion rate versus an average of 86% for native approaches—MCP servers, CLI, or custom connectors. The average summarizes uneven results: seven tests favored Composio, two were ties, and two favored the alternative.
Slack was the clearest example. The native MCP server could attempt 18 of 50 tasks; Composio attempted all 50 and completed 94% successfully. The first integration solved every case it could run, but its coverage was limited. The second covered more tasks with a success rate below 100%. For a company, the difference between coverage and accuracy matters: an aggregate percentage may not describe the set of actions its team needs.
There are also differences between accessibility and efficiency. In a gateway comparison, Composio reduced turns by 41%, calls to the provider by 52%, and total time by 50% compared with Zapier’s MCP gateway; token usage fell by 18%. In another test, loading schemas lazily reduced Arcade’s tokens by 68%, without increasing its success rate. Saving tokens does not, by itself, guarantee that more tasks will be completed successfully.
What teams should measure
For a company running agents at scale, choosing a model based on its advertised price leaves out costs that depend on execution. The evidence points to measuring, separately and on their own tasks, fixed context size, average turns, success rate, time, tokens, and the share served from cache. It is also worth checking which tasks each connector can actually attempt.
The GitHub benchmark repository included among the sources proposes building tests with tasks from real repositories, pinning code references, recording cost, latency, and turns, and scoring results with an independent evaluator. Its own test set published an example of model routing: across 21 tasks, it was 45.4% cheaper with 4.6% lower quality. This is a trade-off measured on that test set, not a guarantee for other teams.
The limitations of the tests are a reason not to turn their figures into a permanent leaderboard. The June evaluation by The New Stack made a single pass for each harness, task, and model, without estimates of variability; agents can also produce stochastic results. Composio, for its part, noted that some costs were recorded in only a portion of cases and that one configuration used different reasoning parameters.
The operational takeaway is not that one particular harness is always cheaper, but that it is part of an agent’s cost and performance. The token gap can originate in the initial message, grow with each turn, and change with caching; the success rate can vary at the same time, and the order of systems does not necessarily remain the same when the model changes. The next step for a team is to check these metrics with its own workflows.