A few months ago we talked about certain Google metrics that were displayed in Search Console. The reason for writing another post on this topic is that Google has changed this again, giving priority to other metrics.
Interestingly, we thought in that previous study that the FCP and FID were not the metrics that should have more weight, as there were others that should be more important in practice, such as CLS.
Well then. In May 2020, Google updated Google Search Console and Google PageSpeed/Google LightHouse with a major change: Core Web Vitals.
With Core Web Vitals you do not add or remove metrics, but simply change the weight assigned in the scores and therefore make certain changes in Google Search Console (where a new tab appears) and Google LightHouse.
Although it was a logical change, I personally didn't expect it to happen so quickly, since in Webpage Optimization matters we can't put Google and "logic" together in the same sentence because they don't go together at all.
With the appearance of the "Core Web Vitals" or "Main Web Metrics" tab in Google Search Console, many websmiths have gone crazy because, suddenly and from one day to the next, their scores have changed and this is precisely because the different metrics have varied in weight.
In the previous post on FCP and FID we showed this table, as FCP and FID were the most important metrics at the time:
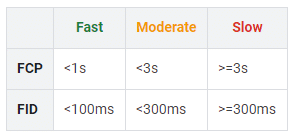
But now, when we change the most important or heavier metrics, we also have to change the table:
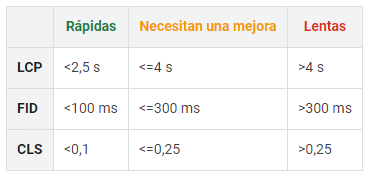
Even if you want to see it in a more graphic way, this is the official image:

All these tables are official, taken from the Google webmaster support website, and serve as a reference for you to see the values you have to achieve in each metric if you want to get a good score in Google PageSpeed Insights.
Now that we are focusing on only 3 metrics (although the others are still there, but with less prominence or integrated in others), we are going to try to explain them and also what we must do to improve them.
The weight or importance of the different metrics in the Google PageSpeed or Google LightHouse score in LightHouse version 6 is this:
- LCP: 20% of total.
- TBT: 20% of total.
- FCP: 15% of total.
- SI (Speed Index): 15% of total.
- TTI: 15% of total.
- CLS: 15% of total.
We will have all these metrics in Google PageSpeed, although most of them are not shown in Core Web Vitals in Google Search Console.
If you want to experiment with the importance of scores, you can use this official Google tool
Optimize and improve LCP
Let's start with the most complex one and see how we can improve this metric.
The LCP (Largest Contentful Paint) is the metric that I mentioned in February 2020 explaining that it made much more sense as the main metric than the FCP. As I said above, curiously enough a few months later Core Web Vitals gave it prominence.

What the LCP measures exactly is the time it takes to render the elements with content from the time the user makes the request to the page. This is a VERY logical metric and, with the current abuse of Javascript by websites, it is normal to have it under control.
To see the current importance of the LCP as a metric, it is the one that has more weight.
What can cause a bad score in LCP?
- Slow response in firstbyte or TTFB: This happens because the website has no page caching system or because the web server has problems and causes important delays. The solution is easy: implement cache and solve server problems if you have them.
- JavaScript and CSS blocking during loading: This is quite common. It occurs when loading heavy scripts without asynchronous loading. These scripts block the website's loading timeline while being interpreted. Normally, we can solve this with an effective asynchronous loading or by removing scripts and CSS.
- Slowness in serving static resources: Static resources such as images, CSS, JS, PDF and everything else needed to view the web must load fast enough. We can optimise the loading of static resources with a CDN service and reduce their weight with techniques such as miniaturisation, if possible.
In summary, some of the techniques that can help us to have a good LCP are the implementation of a CDN, the minimization, the page cache and the asynchronous loading of both Javascript and CSS.
About LCP
As I said, this is a "good" metric that is applicable in practice to Webpage Optimization of most websites.
The fact of measuring the loading speed together with the rendering makes it a metric applicable to practice.
The problem is that, in many cases, it is a very strict metric and has too high a standard to be applied in practice. As a consequence, in many cases, when implementing certain external measurement scripts such as Hotjar or some marketing tool such as Hubspot, we will automatically have a bad score in LCP and also the consequent drop in points in Google PageSpeed.
For me, the metrics are good and accurate. However, as with most things Google does, it lacks quite a lot of transparency. I am aware and have demonstrated that Javascript can block the CPU of a current low-end mobile device and even cause problems for high-end smartphones, which is precisely what allows us to prevent LCP. However, I think it should be cut a little lower so that we can apply the theory to practice.
To sum up, my personal opinion is that this metric is good, the approach is very good, but the scale is wrong and not transparent. For this reason, in many cases you have to give priority to marketing or business decisions instead of earning a few points in PageSpeed at the expense of the LCP.
Optimize and improve CLS
Now we go to the second "new" metric, a metric that can be confusing because of what it measures and because, in some cases, if we relieve a little the LCP we can end up damaging the CLS (Cumulative Layout Shift). It is not exactly an antagonistic metric of the CLS, but some things may overlap.

The CLS measures exactly how much the page layout has changed while elements are being loaded and interpreted.
To give you an example for practical purposes, when we do not specify a size on the images and they load as they are downloaded to the visitor's browser, it is normal that, as they do not have an assigned size, the images move around the screen as they are loaded one after the other. This is penalised by CLS.
For you to see a practical example directly with an image, I have found this:
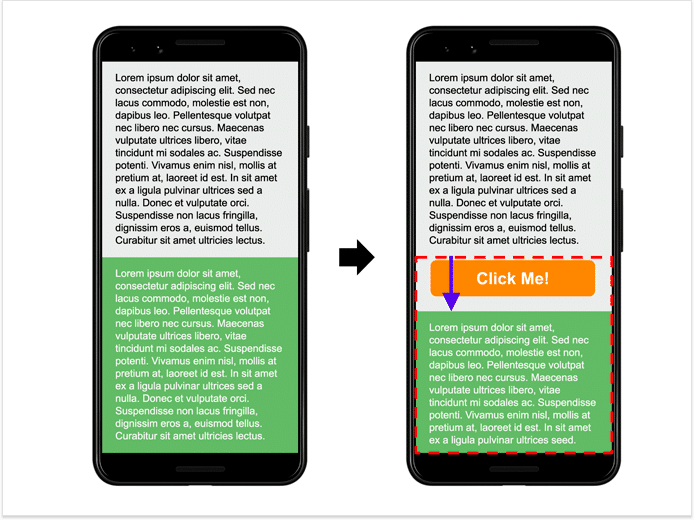
Ideally, the metric should be 0 (perfect), but because it requires certain elements we may not be able to keep it at 0.
What can cause a bad score in CLS?
- Images without the size specified in the code: If we do not specify in the HTML the dimensions of the images using the corresponding tags and attributes, we will see that the CLS has been penalized. This is already done by most of the current Pagebuilders and themes.
- Ads and iframes without the specified size: This can happen with many advertiser networks and many advertising systems, even with Google Adsense. Here we are faced with a good business decision: "make money" versus Webpage Optimization.
- Dynamically injected content: If we inject or modify content dynamically while the website is loading, we will also see the CLS penalized. In complex webs this is one of the main problems we will find, especially in ecommerce where there is a lot of AJAX.
- Loading fonts without styles: When optimizing the loading of fonts from local or Google Fonts, in some cases can be loaded initially without styles to later load the styles and formatting. This gives problems in the CLS, although for the Webpage Optimization is a good technique.
- Any animation or dynamic loading without reloading: Most animations or dynamic loads without reloading the page can penalize the CLS, to a greater or lesser extent, depending on the impact they have on the total content.
As I said at the beginning of the section, the CLS is a complicated metric to understand by its nature. It is not a Webpage Optimization metric, but fits better within a purely UX or user experience metric. For this reason, it is difficult to establish Webpage Optimization techniques to improve the CLS and I personally do not recommend dispensing with certain elements in order to have 0 CLS.
About CLS
As I said before, CLS is more a metric of UX and user experience than Webpage Optimization. CLS has nothing to do with Webpage Optimization. Therefore, there are no techniques that we can apply but rather we can combine some "sacrifice" with good practices.
Personally, I believe that we should not stress about this metric and, of course, I do not recommend dispensing with website functionality in favour of a 0.10 improvement in CLS.
Furthermore, although Google says that CLS is to improve visual stability and UX, I believe that by eliminating certain elements we can go directly against UX.
Optimize and improve FID
I have already talked about the FID metric (First Input Delay) in this blog when I discussed the previous metrics. This is another metric more focused on UX and user experience than on Webpage Optimization. It is a metric that is included within the TBT metric.
What FID measures is the time that passes from the time the user clicks on a button or link on the web until the browser responds. On a practical level, this is useful in websites where the user has to interact a lot with the website and, if Javascript is abused, this metric can be very penalized. The more the website is overloaded with Javascript, the longer it takes to become interactive after loading and the worse the score will be in FID.

What can cause a bad score in FID?
Well, on a practical level and without going into very complex issues, the fucking Javascript that I have already warned about in this post. What can we do to solve it? Minimizing Javascript, reducing Javascript elements and even asynchronous loading could help us a little in some cases.
Miracles do not exist and, if we want less Javascript to be loaded, the only thing we can do is remove elements and scripts, this metric does not usually punish much: if we have a good LCP, we will usually not have problems with the IDF.
About FID
Well, I don't have much to say about FID, except that it is a metric that counts half for Webpage Optimization and half for UX. It is very much related to the issue of Javascript execution and device overload.
Currently, with the LightHouse V6 it does not usually appear much in Search Console, unless the web is very bad at the Webpage Optimization level.
Other metrics TBT, SI and TTI
There are other metrics that do not appear in Google Search Console but we can see them in Google PageSpeed and Google LightHouse.
Some metrics are "included" within others or are in the same part of the process. If we add that to the fact that some appear in Search Console and others do not, in many cases it can lead to confusion.
TTI (Time To Interactive)
This is a fairly practical metric. It is the user's waiting time until they can use the website. This metric is very oriented to Webpage Optimization and, to improve it, we must do exactly the same as to improve the LCP and FCP.
If we improve the LCP, we will also improve the TTI unless we have too many delayed JS scripts that are executed at the end of the visible load while the user can already interact with the website.
TBT (Total Blocking Time)
Another quite important metric that in many cases is replaced by FID, as it is related. Even so, TBT has a 25% weight in the Google PageSpeed score.
The TBT is somewhat more complicated to explain, as it measures the blocking of the main process thread, which is very technical and very specific.
One of the things that most impacts on the TBT (as well as the FID) is the excess of Javascript that we process during the loading of a website.
SI (Speed Index)
This is another metric directly related to Webpage Optimization. It measures exactly how long it takes to see the content on the screen since it starts to "paint".
The Speed Index measures more how the user perceives the loading speed of our website and is a more visual metric than others such as LCP or FCP.
How is it improved? Once again, I would like to emphasize the importance of Javascript and not to use too many DOM elements (very long or complex pages).
Theory vs. Practice
Finally, practice is summarized in loading times and user experience, while metrics and scores are simply theory that may or may not be usable, depending on the nature of the metric.
As I said before, Core Web Vitals has changed things and the metrics make a little more sense, since Google PageSpeed until mid 2018 was directly meaningless as a tool and as a measurement system.
I am also interested in when it is worth sacrificing some elements necessary for marketing or business in order to gain points in PageSpeed and LightHouse.

