With the technology advancements, internet users have developed some standard methods to present data to users.
They include the use of statistical charts and graphs. Presenting data in the form of charts and graphs makes it easy for the users to understand it. For today’s round up, we are presenting you some useful visualization libraries, charts and diagrams so that you can speed up the process of locating certain data through the collected information.
Here is the full list after the jump. We hope that you will like this collection.
Have fun!
Highcharts
Highcharts is a charting library written in pure JavaScript, offering intuitive, interactive charts to your web site or web application. Highcharts currently supports line, spline, area, areaspline, column, bar, pie, scatter, angular gauges, arearange, areasplinerange, columnrange and polar chart types.
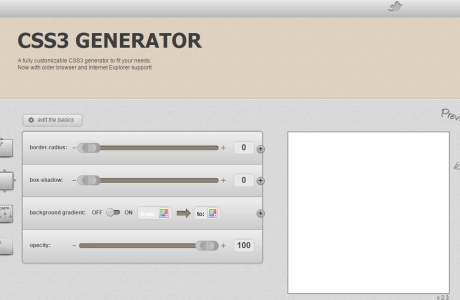
CSS Chart Generator
Enter all the necessary information for your chart. The single items are explained and predefined, so you can simply start changing values. When you are done adding your values, simply click the send button and your chart will be generated in no time and you will receive a link which you can use to display the chart on your page.
AwesomeChartJS
AwesomeChartJS is a simple Javascript library that can be used to create charts based on the HTML 5 canvas element. The main goal during development was to pick sane defaults in order to let the user create simple charts quickly with just a couple of lines of code. One can create at almost no time bar, pie, doughnut and Pareto charts.
Arborjs
A graph visualization library using web workers and jQuery.
InfoVis
The JavaScript InfoVis Toolkit provides tools for creating Interactive Data Visualizations for the Web.
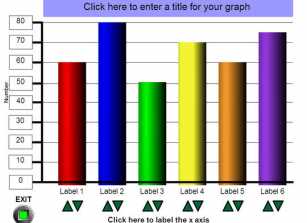
Online Chart Generator
The best online chart and graph generator tool, generate amazing 3D graphs instantly in few seconds.
HumbleFinance
HumbleFinance is an HTML5 data visualization tool written as a demonstration of interactive graphing in HTML5.
RGraph
RGraph is a HTML5 charts library that uses the HTML5 canvas tag to draw and supports over twenty different types of charts. Using the new HTML5 canvas tag, RGraph creates these charts inside the web browser using JavaScript, meaning quicker pages and less web server load. This leads to smaller page sizes, lower costs and faster websites.
CanvasXpress
CanvasXpress is a javascript library based on the canvas tag implemented in HTML5.
Protovis
Protovis composes custom views of data with simple marks such as bars and dots. Unlike low-level graphics libraries that quickly become tedious for visualization, Protovis defines marks through dynamic properties that encode data, allowing inheritance, scales and layouts to simplify construction.
DhtmlxGantt
Use our open source Gantt chart to illustrate a project schedule. You may show the dependency relationships between activities as lines between those activities. Current schedule status can be seen at a glance with percent-complete shadings. Projects, tasks, and activities are comfortably organized into a tree structure (left of the Gantt chart), which can be expanded/collapsed by a single mouse click. Mouseover popups show detailed activity properties.
Smoothie Charts
A JavaScript Charting Library for Streaming Data.
Gliffy
Professional-quality flowcharts, diagrams, floor plans, technical drawings and more. Gliffy works directly in your browser!
Cacoo
Cacoo is a user friendly online drawing tool that allows you to create a variety of diagrams such as site maps, wire frames, UML and network charts. Cacoo can be used free of charge.
ChartGo
Create a graph online quickly. ChartGo is a graph maker tool. Simply follow these steps; pick your settings, paste your data and click the create button.
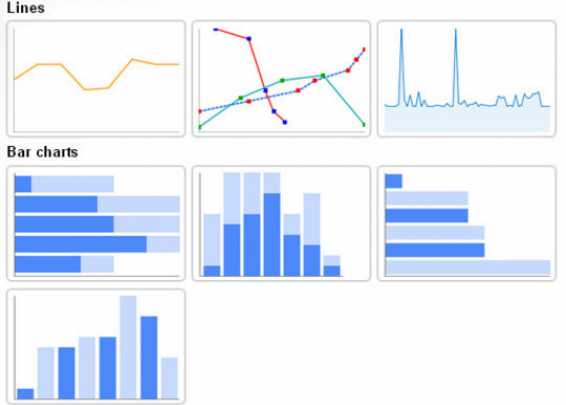
Google Chart Tools
Google chart tools are powerful, simple to use, and free. Try out our rich gallery of interactive charts and data tools.
Creately
Quickly draw organizational charts with our easy to use tools. No downloads or installations, so you can get started immediately.
yEd Graph Editor
yEd is a powerful desktop application that can be used to quickly and effectively generate high-quality diagrams. Create diagrams manually, or import your external data for analysis. Our automatic layout algorithms arrange even large data sets with just the press of a button.
XML/SWF Charts
XML/SWF Charts is a simple, yet powerful tool to create attractive charts and graphs from XML data.
BARCHART Generator
With Make bar chart you can create barchart online tool piechart graph without applet bar graph creation make a bar graph image for your report- create make save for free chart freechart data input chart.
Online Chart Tool
Charts are a great tool because they communicate information visually. On Onlinecharttool.com you can design and share your own charts online and for free.
DhtmlxChart
dhtmlxChart is a JavaScript charting library for generating cross-browser HTML5 charts. It supports the most common chart types: line, spline, area, bar, pie, donut, scatter, and radar charts. For complex charting needs, you can create a chart series, plotted separately side by side, or stacked.
Grapher
Hohli Charts
Ajax MGraph
DIY Chart
DIY (Do it yourself) Chart is a Web-based, simple and powerful online tool to create interactive charts and graphs from static or dynamic data which may be generated using any scripting language.
Xml/Swf Charts
A simple, yet powerful tool to create attractive charts and graphs from dynamic XML data.
ChartDemo
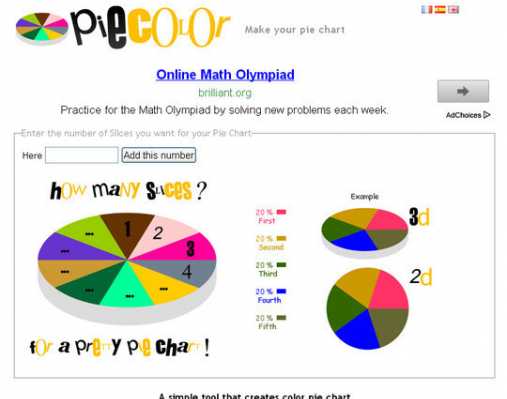
Piecolor
Fooplot
Online graphing calculator and function plotter.
Axiis
Axiis is an open source data visualization framework designed for beginner and expert developers alike. Whether you are building elegant charts for executive briefings or exploring the boundaries of advanced data visualization research, Axiis has something for you.
Fly Charts
FlyCharts is our new version (2.0) of flash charts component. The second version brings you more ways to visualize your data, much more rich and customizable interface, fast and easy tuning of your component. And it’s still free for private persons, still tiny and fast!
Fusion Charts
FusionCharts Free is an open-source Flash charting component that can be used to render data-driven & animated charts in your web applications, desktop applications and presentations. It is a cross-browser and cross-platform solution that can be used with PHP, ASP, ASP.NET, JSP, ColdFusion, Python, RoR, simple HTML pages or even PowerPoint Presentations.
Jfree Chart
JFreeChart is a free 100% Java chart library that makes it easy for developers to display professional quality charts in their applications.
Open Flash Chart
Open Flash Chart, is open source. It is free to use and you get the source code to fiddle with.
pChart
pChart is a PHP class oriented framework designed to create aliased charts. Most of todays chart libraries have a cost, our project is intended to be free. Data can be retrieved from SQL queries, CSV files, or manually provided. This project is still under development and new features or fix are made every week.
Raphaeljs
gRaphaël’s goal is to help you create stunning charts on your website. It is based on Raphaël graphics library. Check out the demos to see static and interactive charts in action.
Plotkit
PlotKit is a Chart and Graph Plotting Library for Javascript. It has support for HTML Canvas and also SVG via Adobe SVG Viewer and native browser support.
ChartGizmo
With your free account from ChartGizmo you can now create charts for your website, blog and social network profiles. ChartGizmo may be useful for those who need to visualize financial, scientific or other type of data.
DrawAnywhere
No download, no-install. Log in from anywhere & draw.