PHP is faster and most used scripting language in practice; contains many features such as detailed documentation, a huge community, myriad of ready-to-use scripts and well-supported frameworks. Its quite easy to get started with PHP than with other scripting languages such as Python, or Ruby because of the features PHP provides.
PHP Developers keep looking for useful PHP tools for creating innovative and interesting web applications. In this article I have gathered 12 PHP Debugging Tools for Developers which will help developers to easily find out and debug the errors in their applications and scripts. Following PHP debugging tool supports Ajax requests and includes generic data collectors and stack based error handling. I hope you will find the list handy and useful for your upcoming projects.
If you like the article you might be interested in our other articles on 8 New PHP Tools for Developers and 10 Useful PHP Scripts.
1. Kint
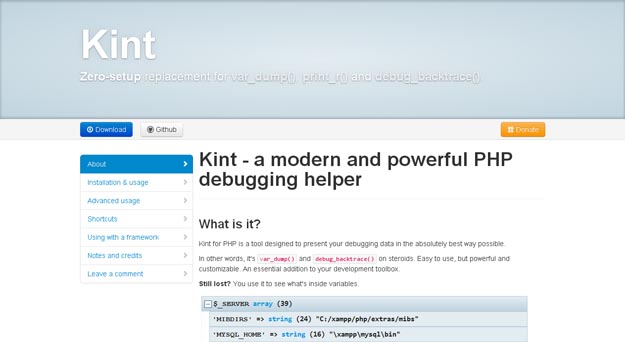
When debugging PHP code, var_dump(), print_r() and debug_backtrace()are usually our best friends. Kint, an open source resource, is a zero-setup replacement that offers a better debugging experience. It smartly detects the type of data being dumped displays tailored alternatives to otherwise hardly readable data. The name of the variable, file, its line and the function wrapping it are all presented.
2. DebugBar
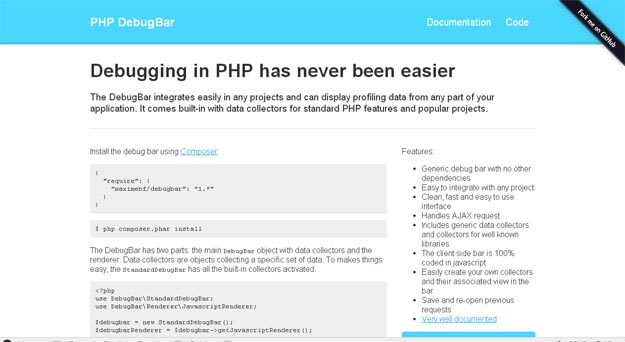
DebugBar is a free and open source app that can integrate into any PHP project and collect + present profiling data. It has no dependencies, supports Ajax requests and includes generic data collectors and collectors for well known libraries. The bar is 100% JavaScript that sits in the footer (like Dev. Tools). New collectors and views can be added with ease and it is possible to save/re-run previous requests.
3. Pinba
Pinba is an open source MySQL storage engine that acts as a statistics server for PHP. It uses the data received to to analyze the performance of PHP apps and locate any problems quickly.
4. PHPMD
PHPMD is an easy to configure, user-friendly front-end for the raw metrics that PHP Depend measures. It looks for several potential problems in your code, including possible bugs, suboptimal code, unused parameters, and more.
5. Xde Bug
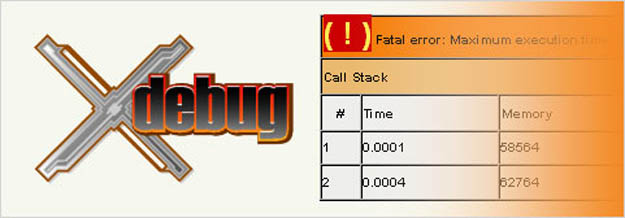
Xdebug is a free and open source PHP extension for debugging and profiling PHP scripts in detail. Considering it is an extension, the usage is easy and requires very few things to setup in the code-side. It can provide data on stack traces and function traces in error messages with full parameter display for user defined functions, function name, file name and line indications. Xdebug can also present the memory allocation, profiling information and code coverage analysis.
6. Whoops
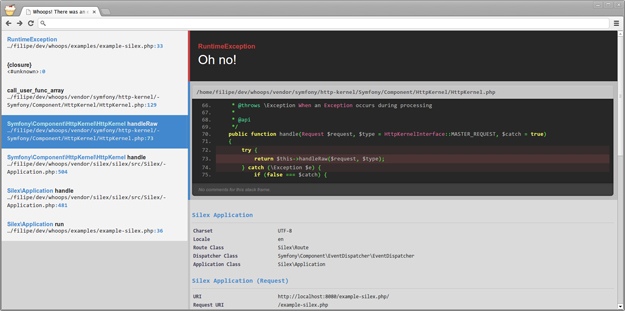
Whoops is a PHP library for handling errors and debugging them much easily. The library provides stack-based error handling with a good-looking error interface. It has a simple API for dealing with exceptions, trace frames + their data and can integrate with any framework (ready-to-use integrations exist for end and Silex).
7. Krumo
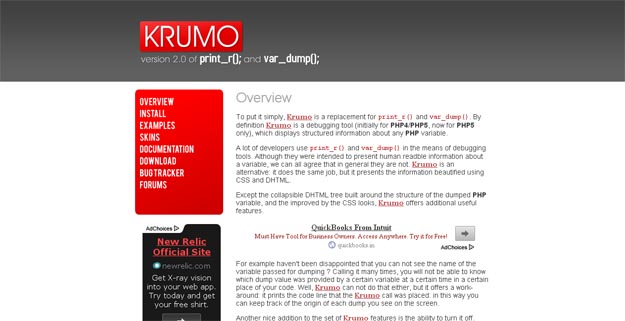
Many PHP developers use print_r() & var_dump() for debugging which output hard to read/unformatted results. Krumo is a replacement for these functions which can display structured information about any PHP variable. Once Krumo is ran, the output is displayed in a collapsible DHTML tree built around the structure of the dumped PHP variable. Also, it speeds up the debugging process by the ability of turning it âoffâ rather than disabling every dumping route inside the code.
8. Php Debugger
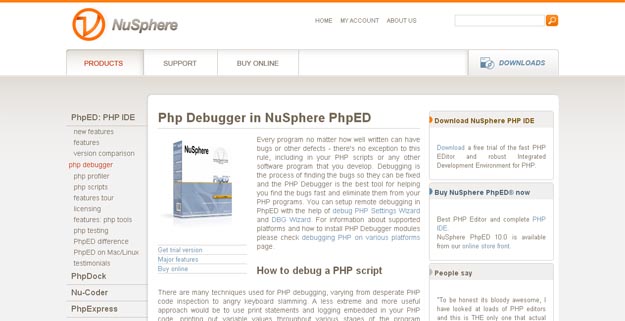
Debugging is the process of finding the bugs so they can be fixed and the PHP Debugger is the best tool for helping you find the bugs fast and eliminate them from your PHP programs. You can setup remote debugging in PhpED with the help of debug PHP Settings Wizardand DBG Wizard.
9. Php Debug
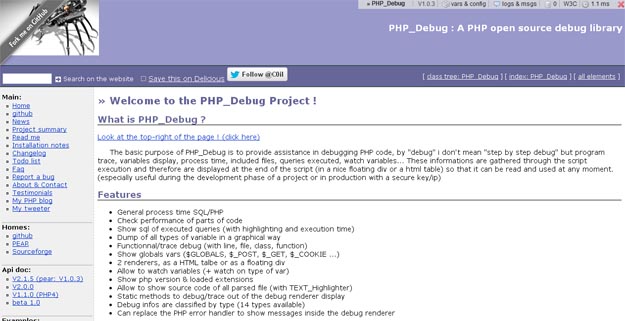
The basic purpose of PHP_Debug is to provide assistance in debugging PHP code.
10. Webgrind
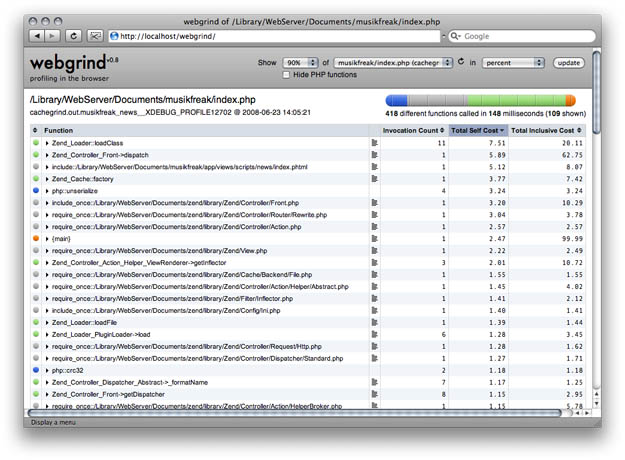
Xdebug is one of the most popular debugging PHP extensions. It provides a ton of useful data to help you quickly find bugs in your source code.
11. PHP_Dyn
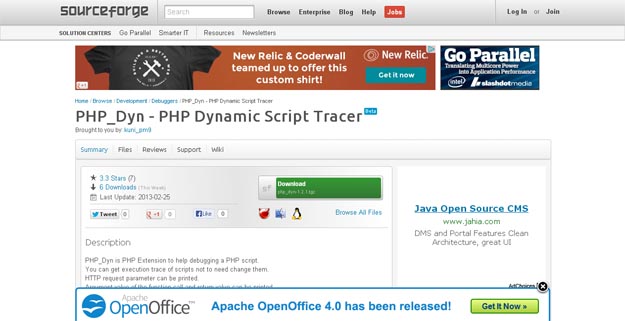
PHP_Dyn is another excellent PHP debugging tool thatâs open-source. You can trace execution and get an output of the argument and return values of your functions.
12. MacGDBp
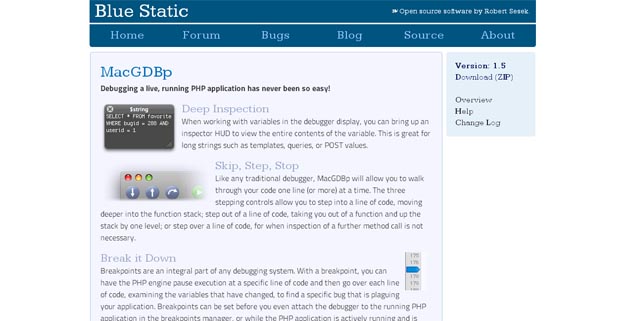
MacGDBp is a live PHP debugger application for the Mac OS. It has all the features youâd expect from a fully featured debugger, such as the ability to step through your code and set breakpoints.